Web UI tutorial
6 minute read
Setting up a Workspace
First of all, we will need a Workspace to put our data into. Let’s go ahead and create one!
-
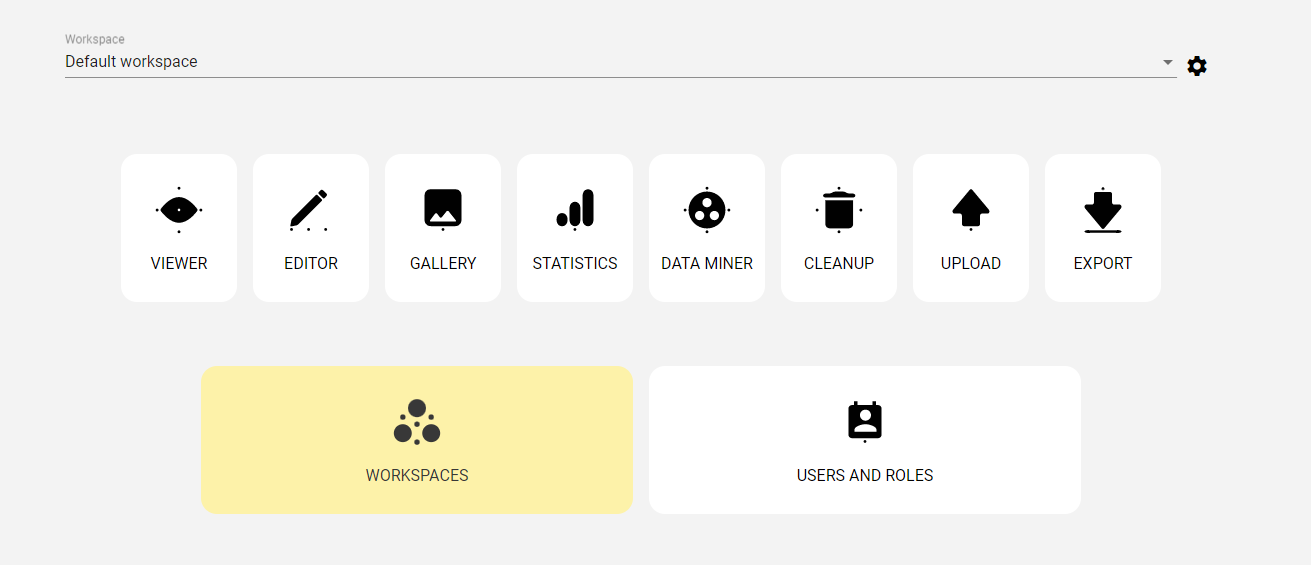
On the Dashboard click Workspaces to access Workspace management.
Figure 1. Dashboard - Workspaces -
By clicking the
Newbutton create a new Workspace.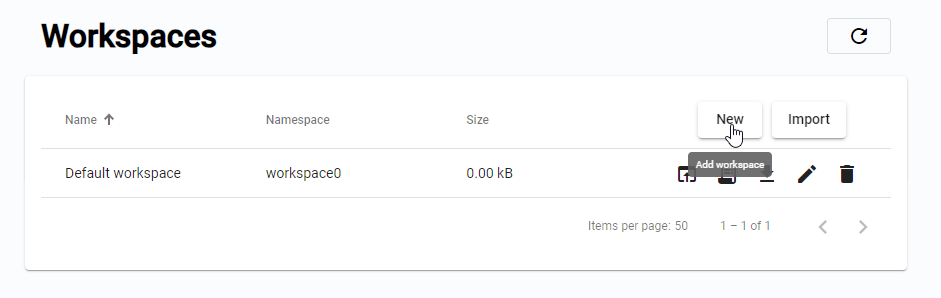 Figure 2. Add new Workspace
 -
Name it “Tires” and use “tires” as the namespace. The Workspace ID will be generated automatically.
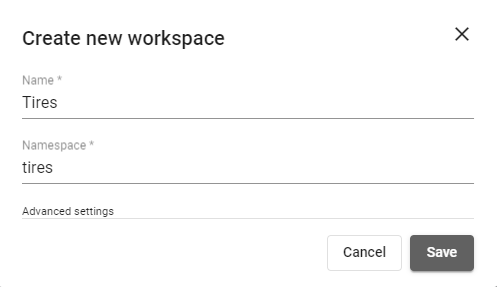 Figure 3. Creating Tires Workspace
 -
After confirming by clicking the
Savebutton, the newly created Workspace is displayed in the list. -
Return to the dashboard and select it.
 Figure 4. Selected WorkspaceImportant
Make sure to select the newly created Tires Workspace using the Workspace selector. The name of the selected Workspace is visible on top of the page all the time. You can return to the Dashboard by clicking on the
BeeYardlogo.
Uploading data
Once the the Workspace is ready, let’s start by uploading our data into it.
-
Download tires.zip file and extract it. The folder structure is the following.
Tire folder structuretire0 bottom.png top.png tire1 bottom.png top.png ... -
A suitable upload for this type of data is the built-in Folder upload. Access it by clicking the
Uploadapp icon on the Dashboard.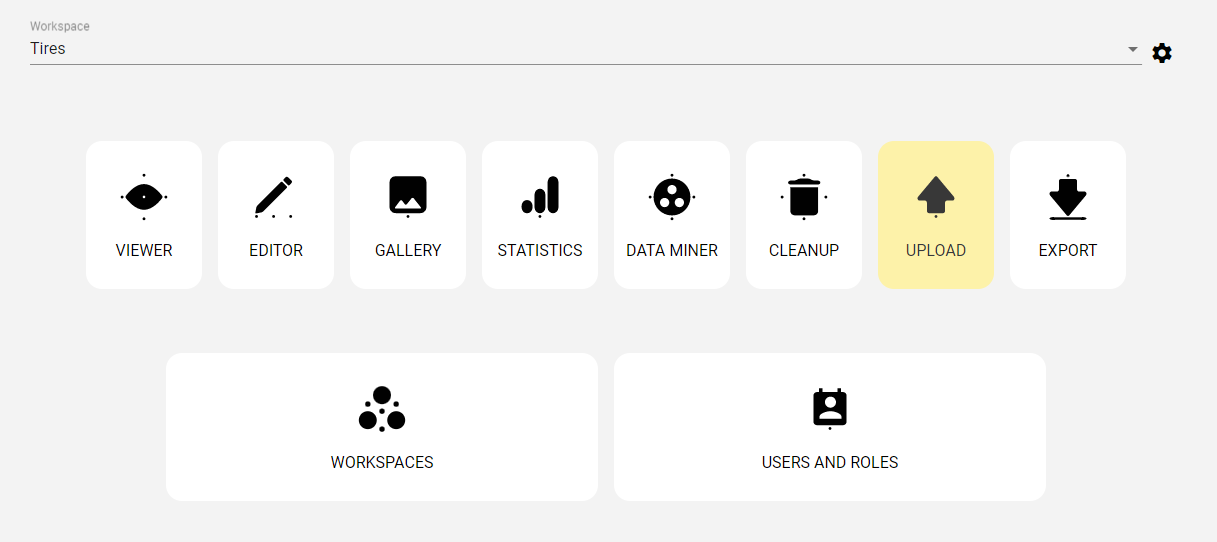 Figure 5. Dashboard - upload
 -
Select
Folderstab. Each folder will be uploaded as a new Cell.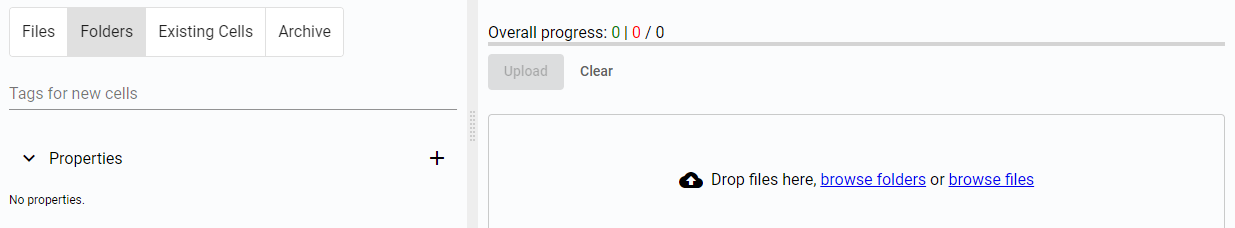 Figure 6. Upload folders
 -
Click
browse, select the extracted tires folder and confirm.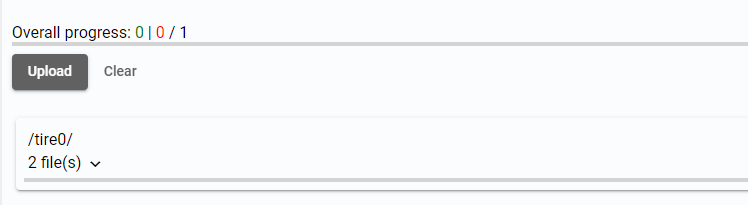 Figure 7. Data prepared for upload
 -
Click the
Uploadbutton to initiate the upload of the selected data.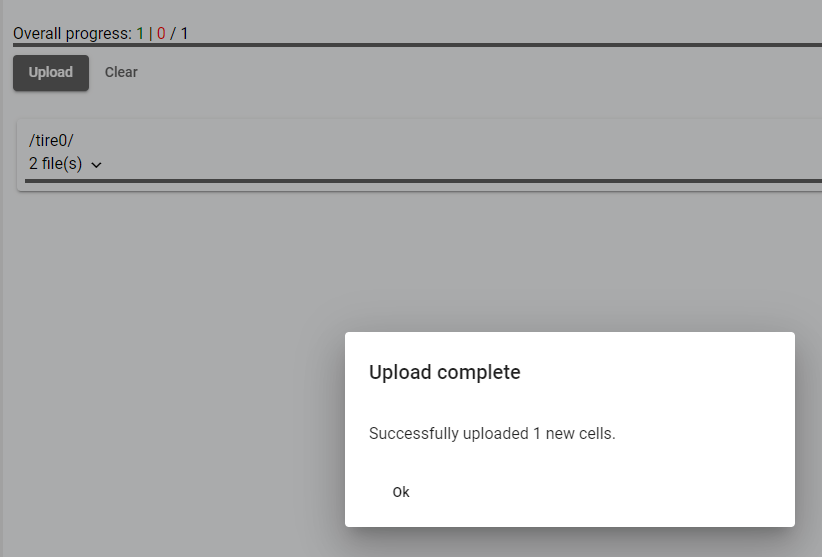 Figure 8. Data uploaded
Inspecting the tires
Each folder on the disk has been uploaded as a Cell — a BeeYard data container that contains both data and metadata. In our case it has two images (top and bottom) and some metadata such as created, uploaded and modified timestamps, size and version. It also contains Tags and Properties that have been automatically created for us during the upload. Since each tire contains two images, let’s adjust the layout, so we can see both of them at the same time!
-
First open the
Viewerapp.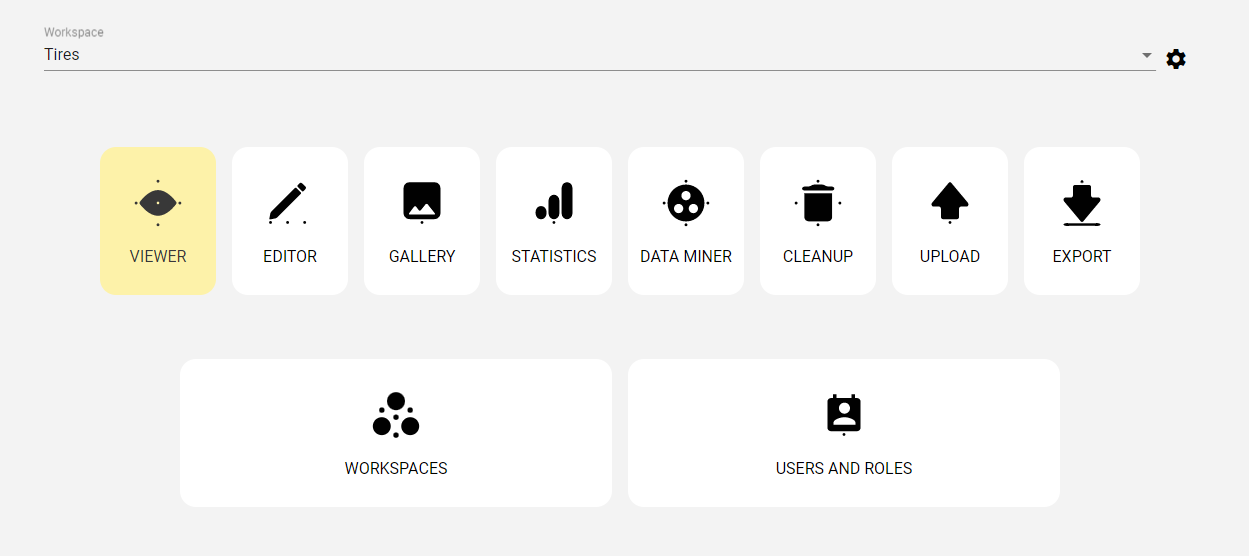 Figure 9. Dashboard - viewer
 -
Click the three dots menu in the upper right corner and select
2 Views horizontal.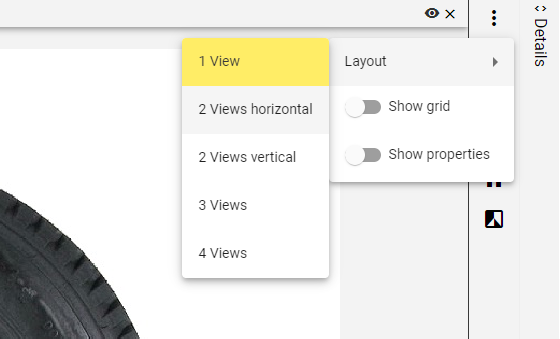 Figure 10. Layout selection
 -
Each Viewer gets selected by clicking into it. Once it has a focus, all selected data from the Cell info pane will be displayed in it. Let’s select the Viewer on the left and click top.png in the Cell info pane. Then select the right Viewer and click bottom.png. Now both images are displayed next to each other.
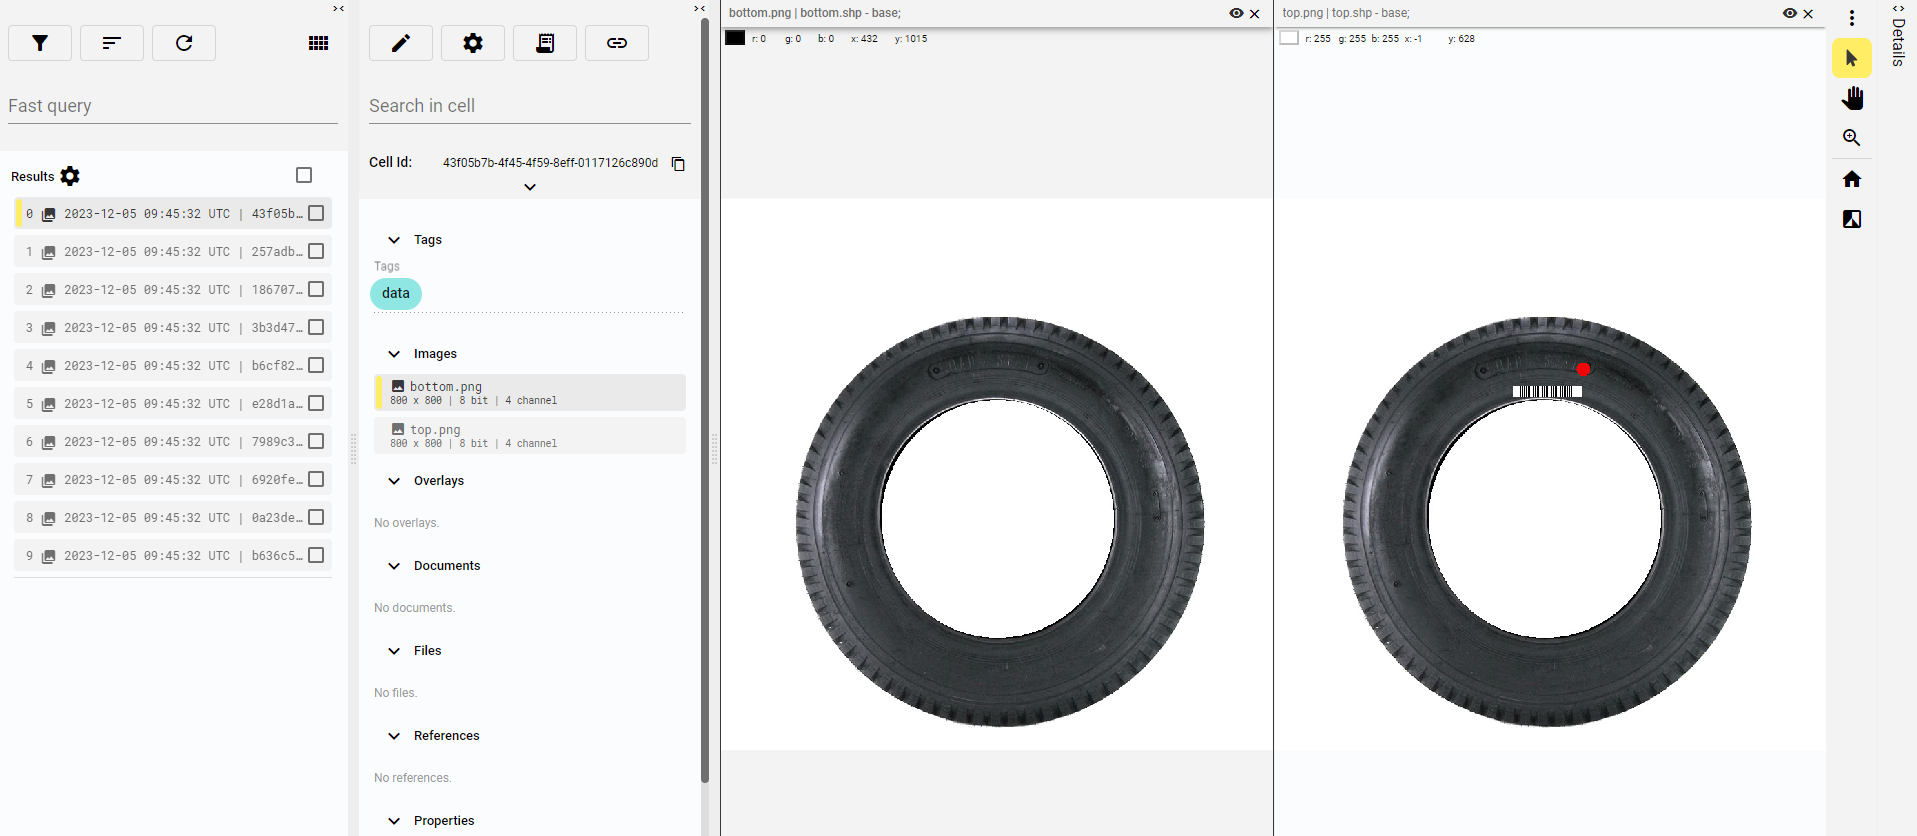 Figure 11. Top and bottom images
 -
Let’s see other tire images! The layout is preserved when selecting other Cells in the Cell search pane.
|
Note
|
Arrow keys or keyboard shortcuts (ALT+S next, ALT+D previous) can be used when navigating through the Cells. You can view the list of currently available shortcuts by clicking the question mark icon in the top right corner.
|
Working with Shapes
Tires contain red, blue and green markers on the top and bottom images. Thus, our next task is to annotate the images, so that we have ground truth data for later use. BeeYard offers various image annotation options and we will use rectangles for the sake of this tutorial.
|
Note
|
Default Shape templates are automatically generated when creating a new Workspace. Shape templates management is located in the Workspace setting. There you can add new Shape templates or change the existing ones. |
Annotation using Rectangles
Go to Editor to be able to add Shapes.
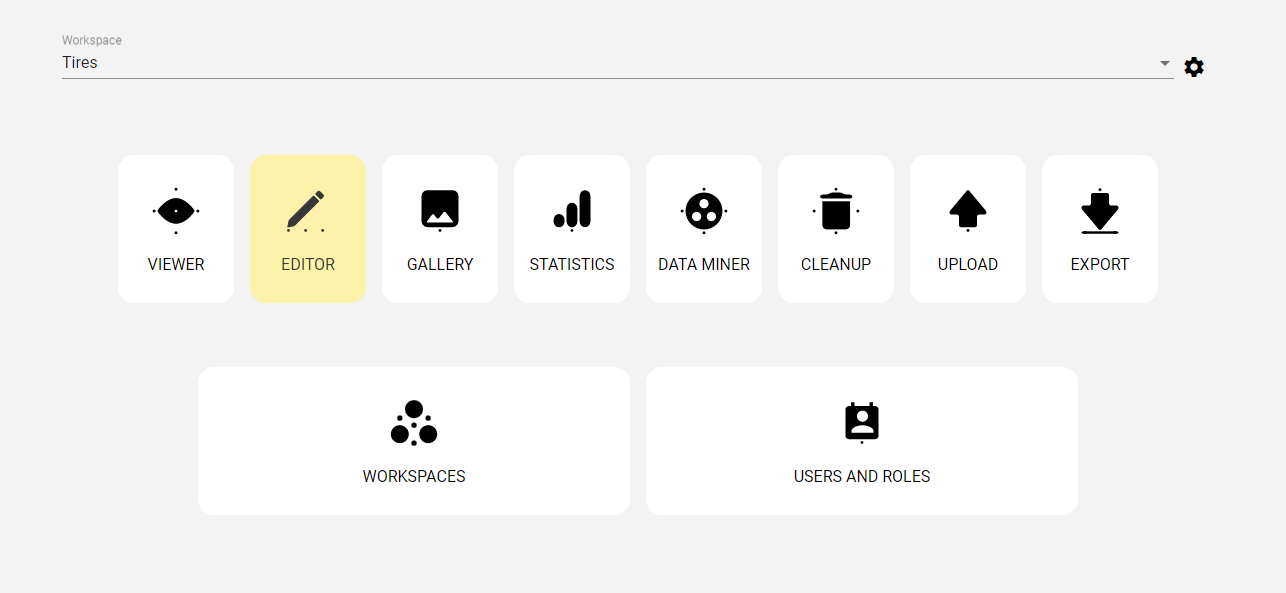
Figure 12. Dashboard - editor
|
Note
|
Our two viewer layout should be preserved. Refer to the Inspecting tires section on how to set it up, if not. |
Seeing both images at once, we can start annotating our images with rectangles.
-
If the first tire has no markers, we’ll navigate to another one that has some.
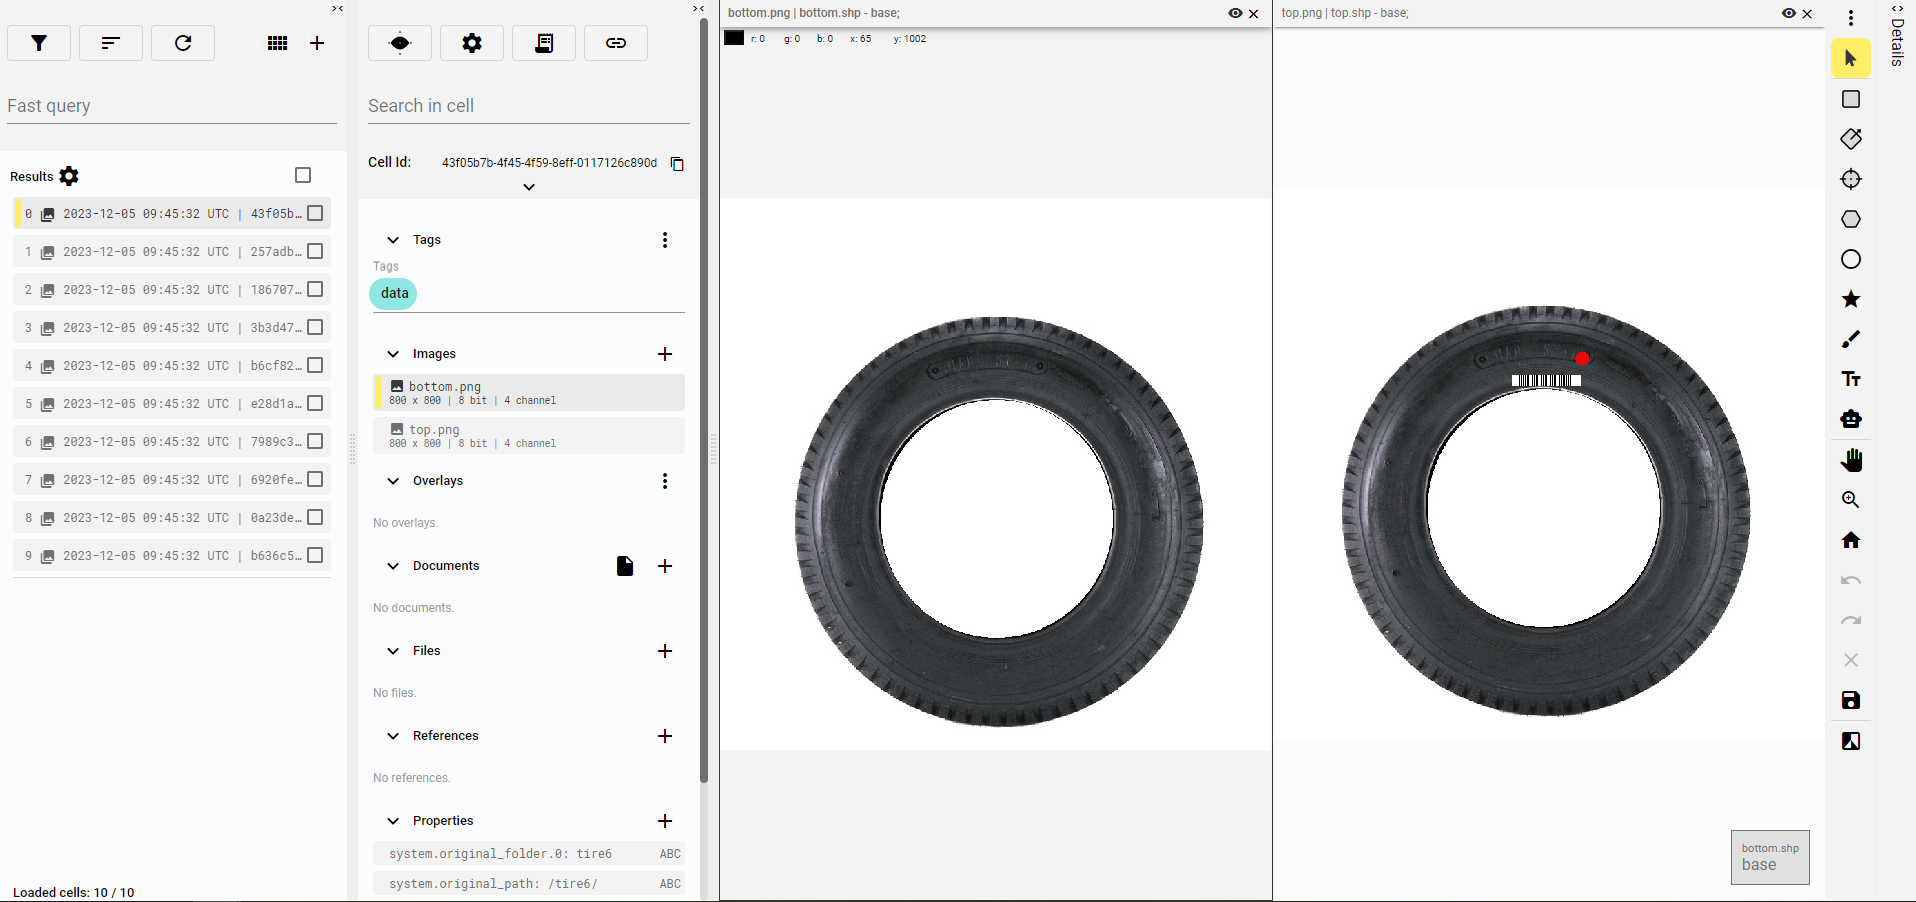 Figure 13. Annotation panel
 -
Click on
Add rectanglebutton in the Annotation panel on the right.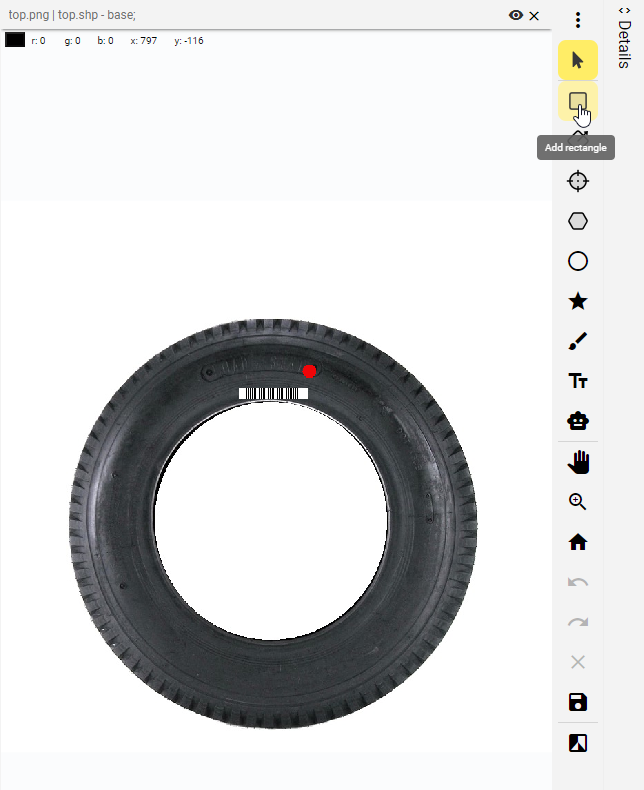 Figure 14. Annotation panel
 -
Select the Viewer and the first Shape template from the Rectrangles section and then create the rectangle by left clicking and moving the mouse.
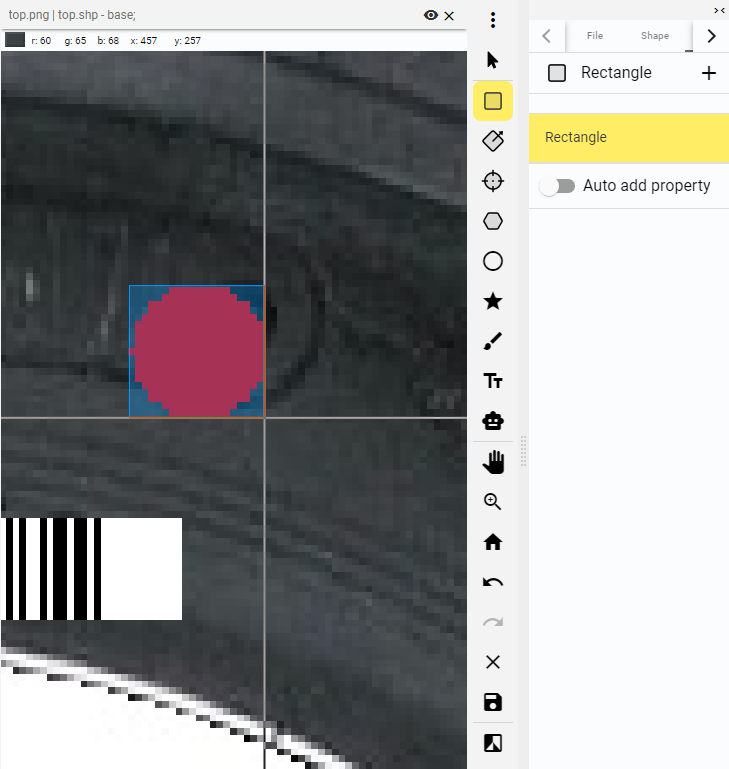 Figure 15. Create rectangle
 -
Repeat the same procedure for all the markers on the tire.
-
Finally, click the
Savebutton in the Annotation panel to persist your changes. It creates two new Overlays that contain our just created Shapes. These are now also accessible in the Cell info pane.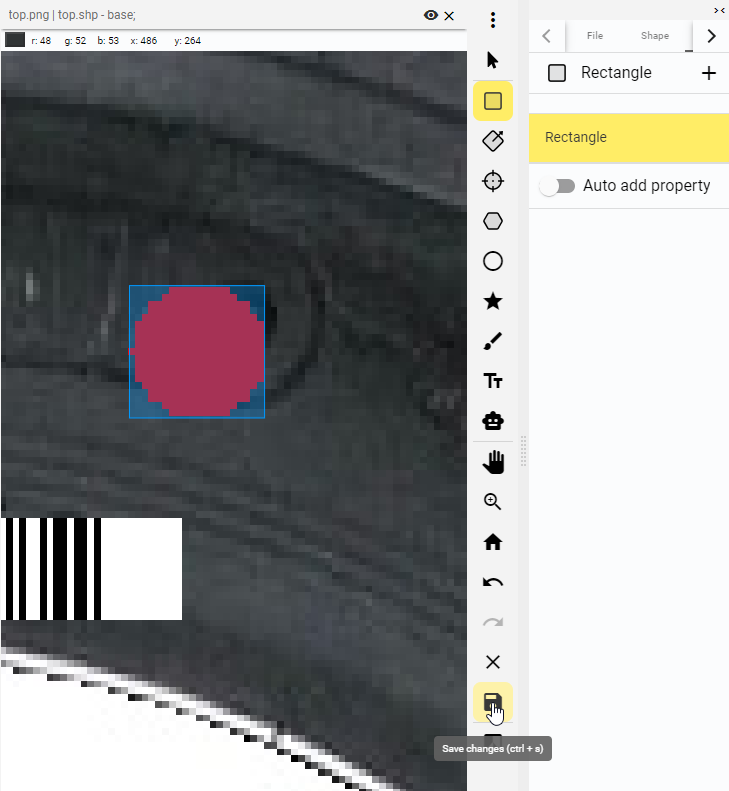 Figure 16. Save overlays
|
Tip
|
Selecting Shape templates for annotation and saving changes can be also accomplished using keyboard shorcuts — ALT+Q, W, E etc. to select the Shape template, and CTRL+S to save changes.
|
We are now ready to repeat the procedure on the remaining tires. However, don’t mark invalid dots (i.e. dots outside the tire boundary) during the annotation.
|
Note
|
If an Overlay matches the name of an image, that Overlay is automatically displayed together with the image. If you want to display a different Overlay, click on its name in the Cell info panel. |
Working with Tags
Adding Tag template
Tag templates have to be created before being able to annotate Cells or Files using Tags. Tag templates can be managed in the Workspace settings.
-
Go to Workspace settings and click
Edit workspace.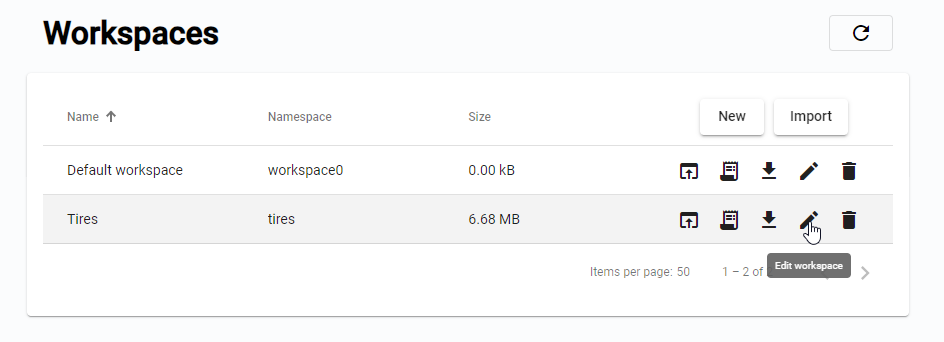 Figure 17. Edit Workspace
 -
Go to
Tagstab and pressAdd tagbutton.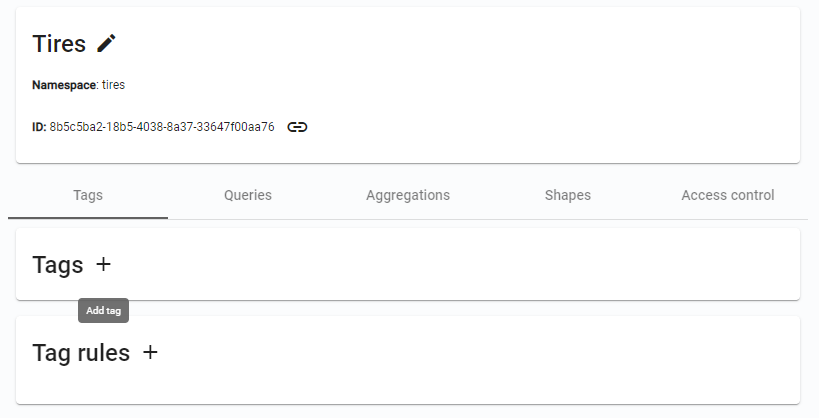 Figure 18. Add Tag template
 -
Enter a new Tag category and Tag name.
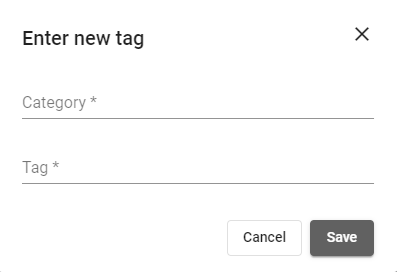 Figure 19. Add Tag template
 -
Repeat the same procedure for other Tags and keep them in the same category. Once the category exists, it is selectable, no need to type it again.
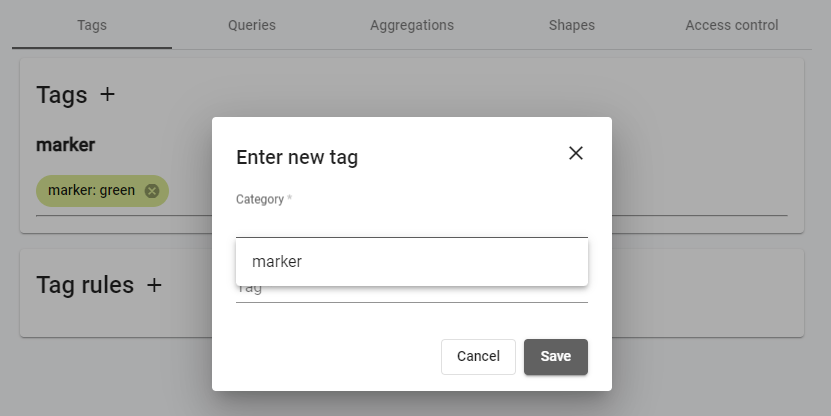 Figure 20. Tag category
Annotation using Tags
Once our Tag templates are created, let’s open the Editor app again!
The same viewer layout should be preserved, refer to the Inspecting tires section on how to set it up, if not.
-
If the first tire has no markers, we’ll navigate to another one that has some.
-
Click on the line with already displayed Tags. There is a default system
dataTag that is automatically added to each created Cell.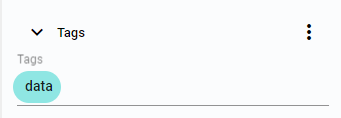 Figure 21. Tags
 -
Pick the Tag fitting to the tire marker from the list of all available Tags.
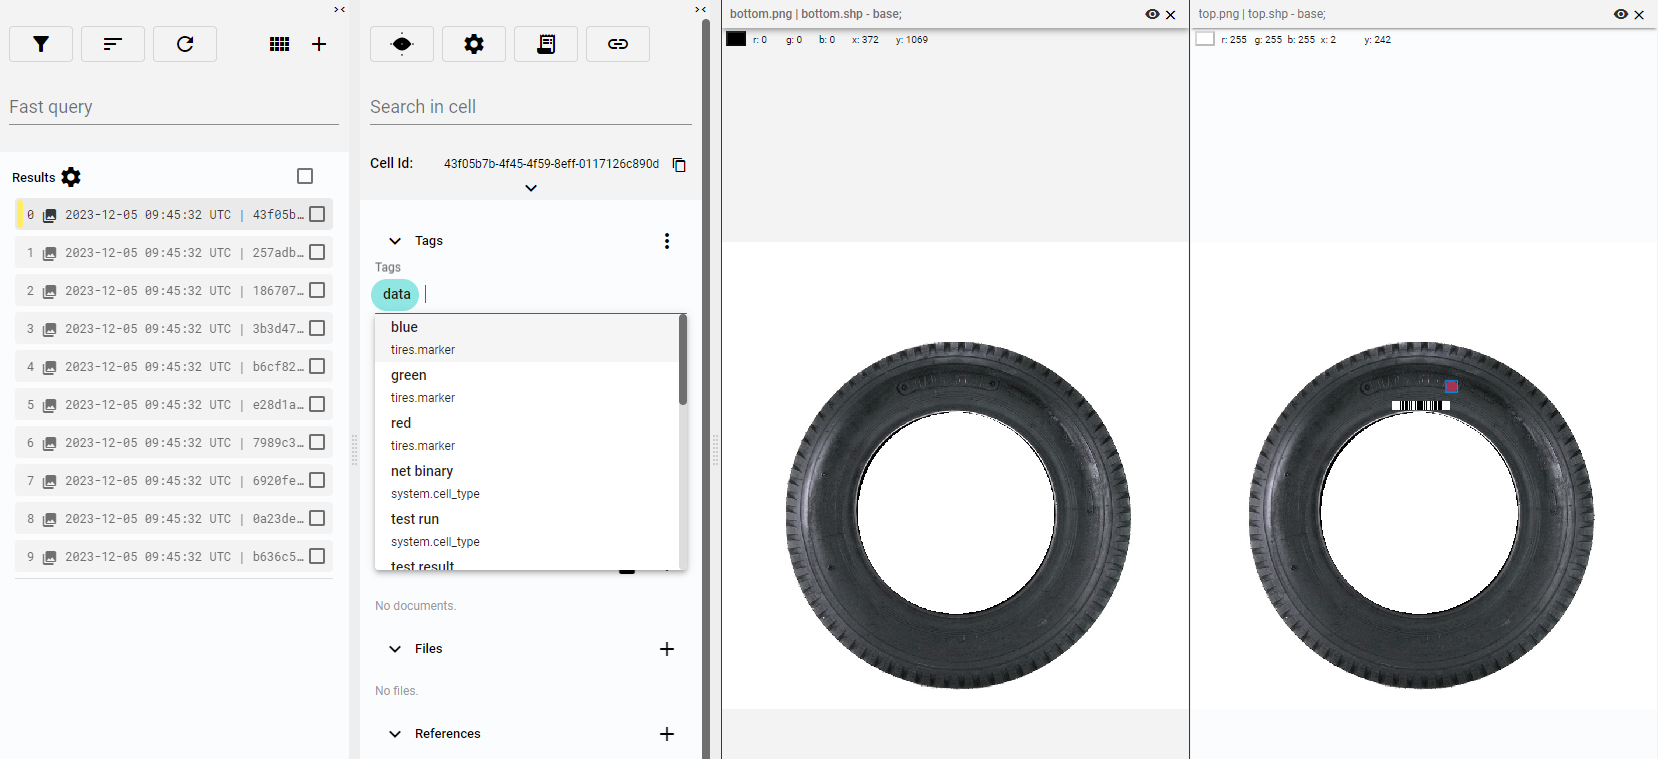 Figure 22. Add tag
 -
Repeat the procedure for all the markers in the images. As the Tag is used, it is removed from the list of available Tags.
Statistics
Let’s review our dataset.
-
Open the Statistics app on the Dashboard.
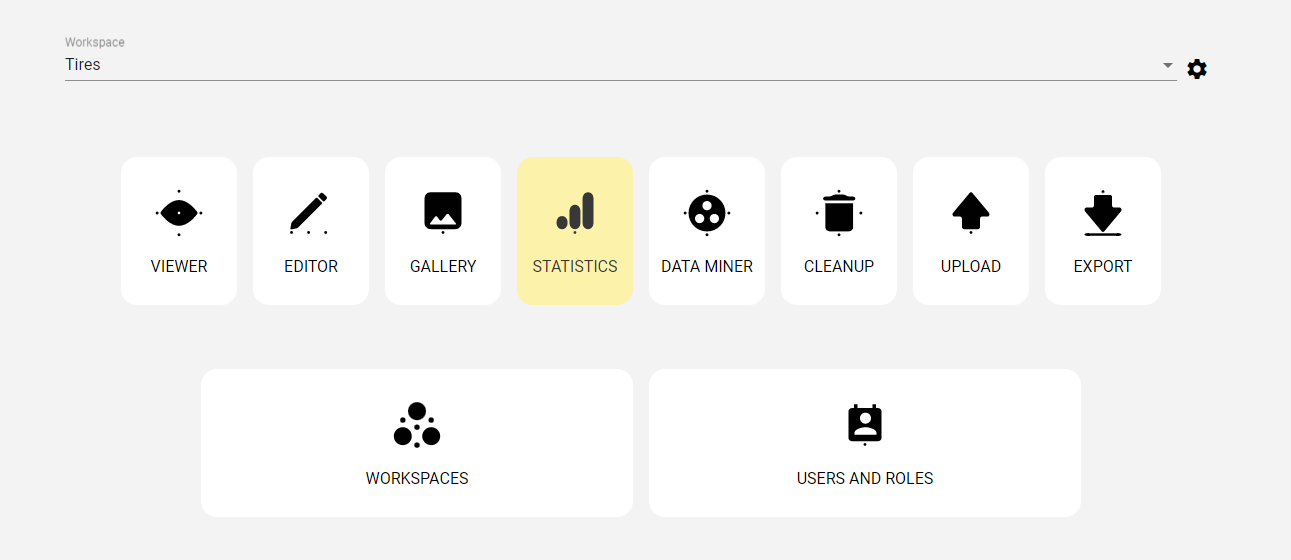 Figure 23. Dashboard - statistics
 -
You will see both the global Cell statistics per Hive as well as the Cell count in the current Workspace. You’ll find a short Tag and Shape overview in the graphs below.
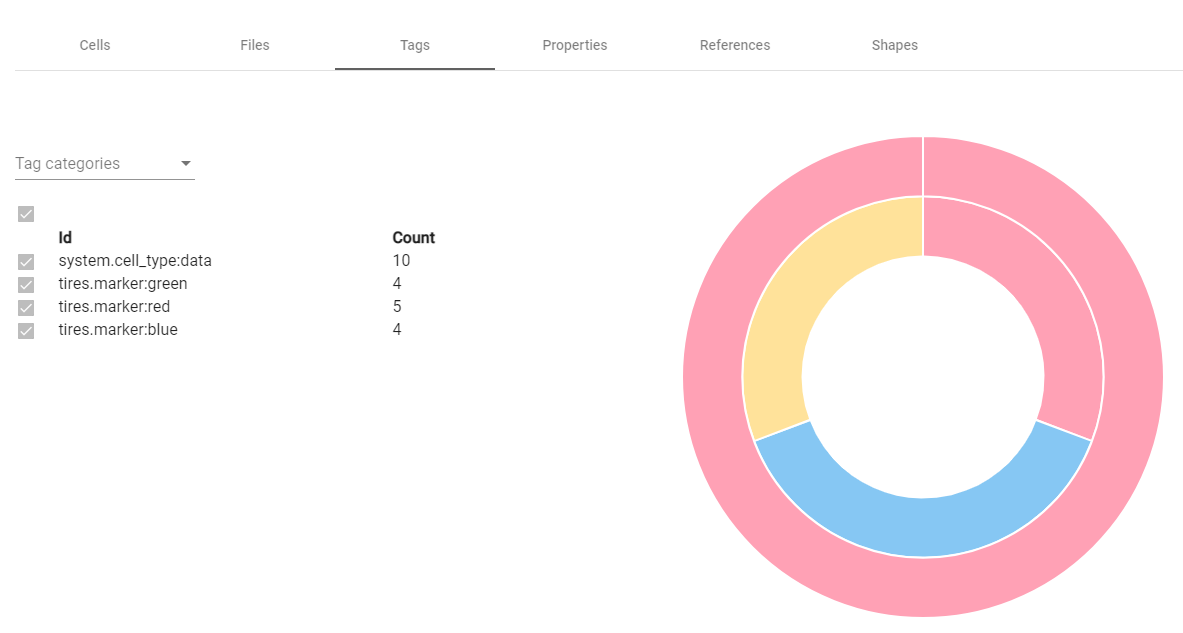 Figure 24. Tags on tires.png