Statistics app
2 minute read
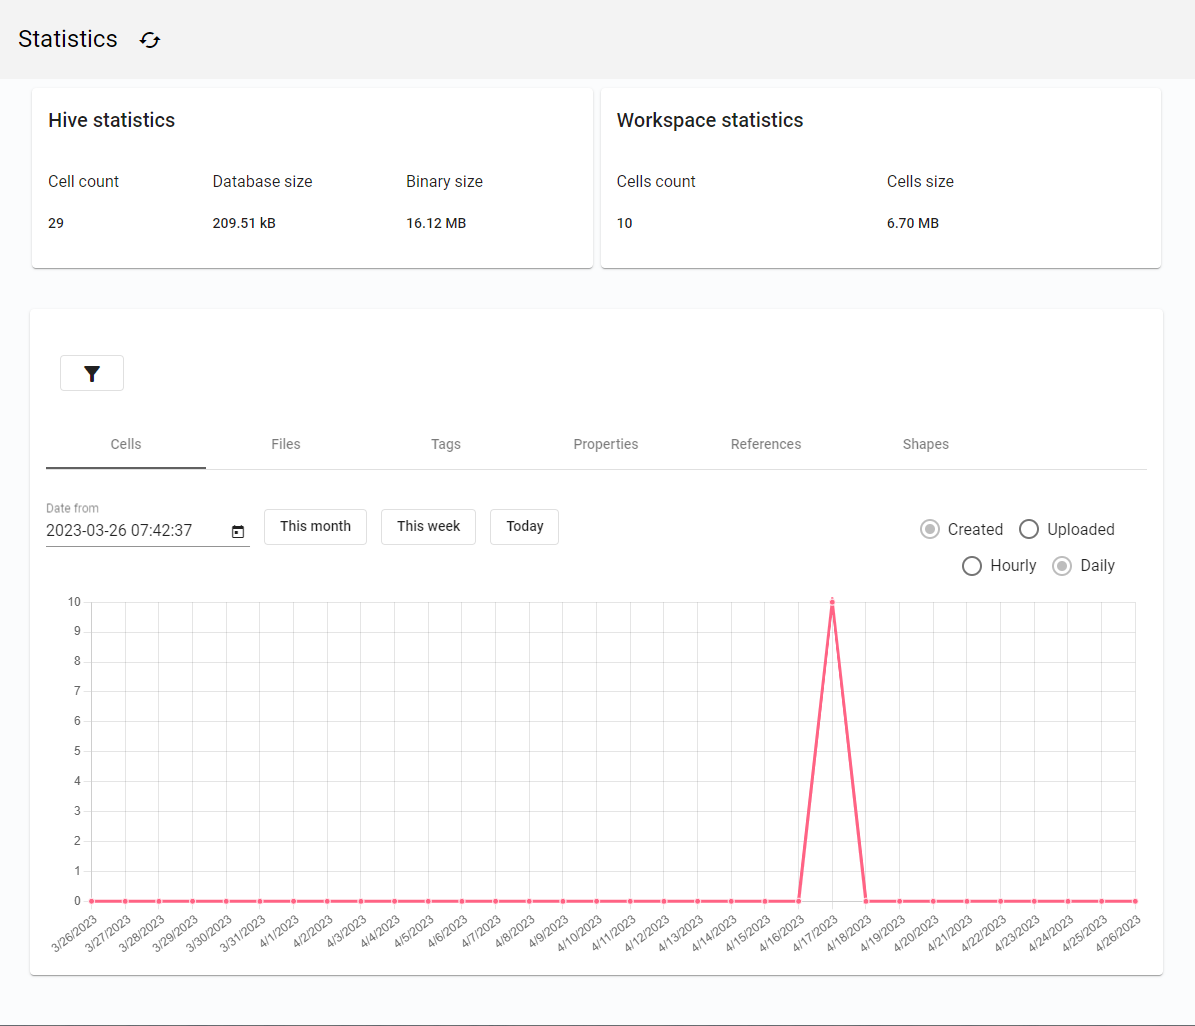
The statistics provide a summary of information about the BeeYard Hive itself, the selected Workspace, and each type of item in the Workspace.
Figure 1. Statistics
Hive statistics
This section presents global information about the BeeYard Hive, such as the number of Cells and the overall data size.
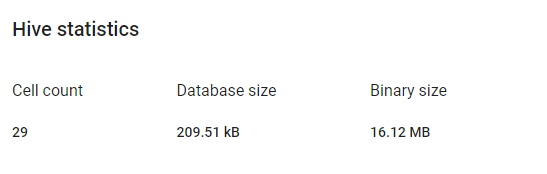
Figure 2. Hive statistics
Workspace statistics
Here, you can find specific information about the selected Workspace.
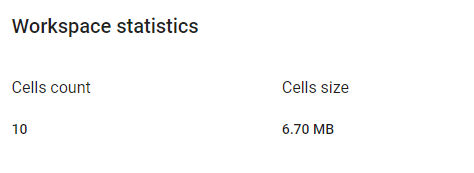
Figure 3. Workspace statistics
Data statistics
Detailed statistics are generated from the data within the selected Workspace. You can choose to display statistics for all items or only for query results.
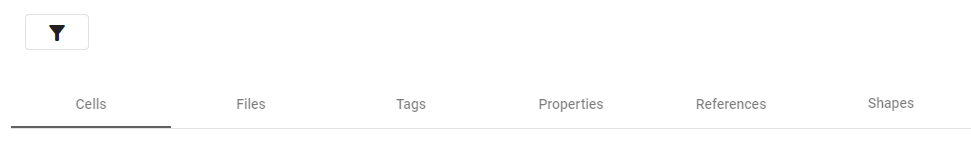
Figure 4. Data statistics categories
Cells
The Cells statistics display information about the creation or update time of the Cells. You have the option to set the starting time period or select from predefined options.
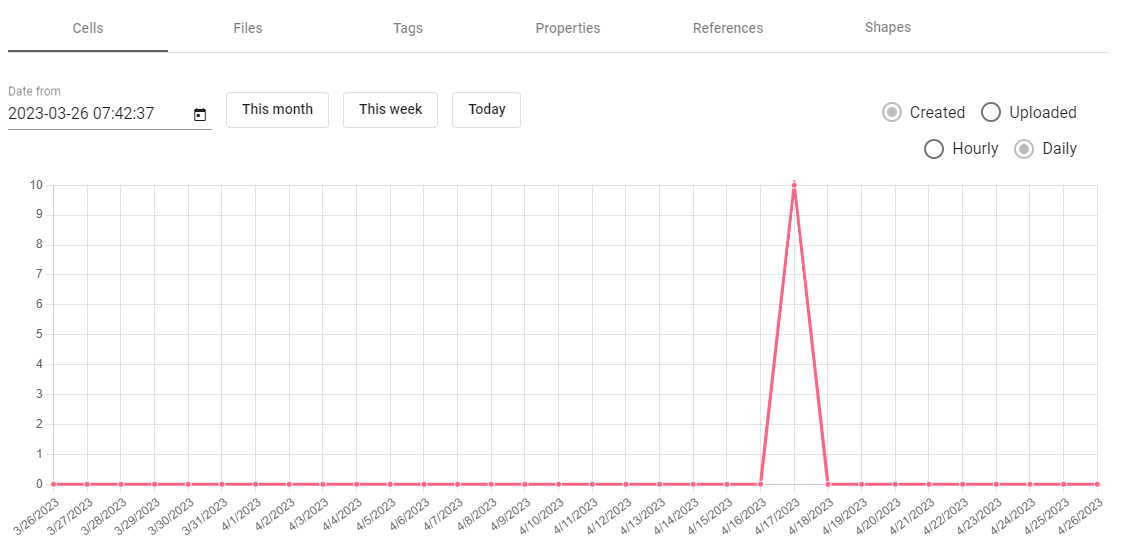
Figure 5. Cells
Files
The Files statistics provide information about the number and size of selected Files. You can sort the Files by name, mime type, or data type. The inner ring in the graph compares sizes, while the outer ring compares the quantity.
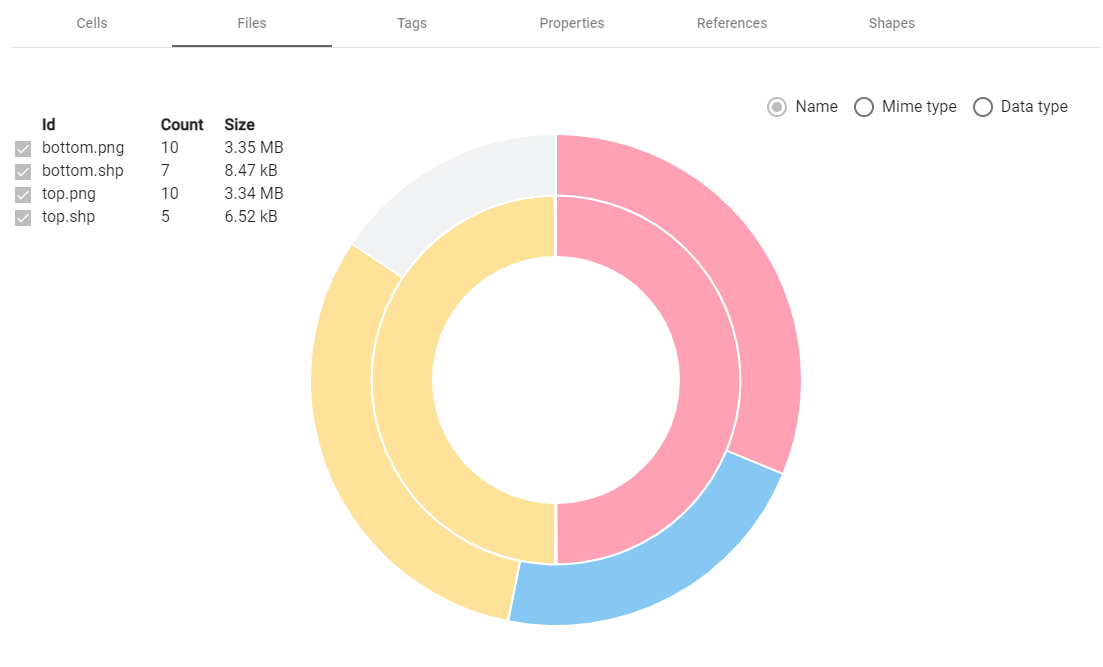
Figure 6. Files size graph
|
Note
|
Files with unique names are not displayed. |
Tags
The Tags statistics show information about the frequency of each Tag used in the Workspace. Each ring in the graph represents a Tag category.
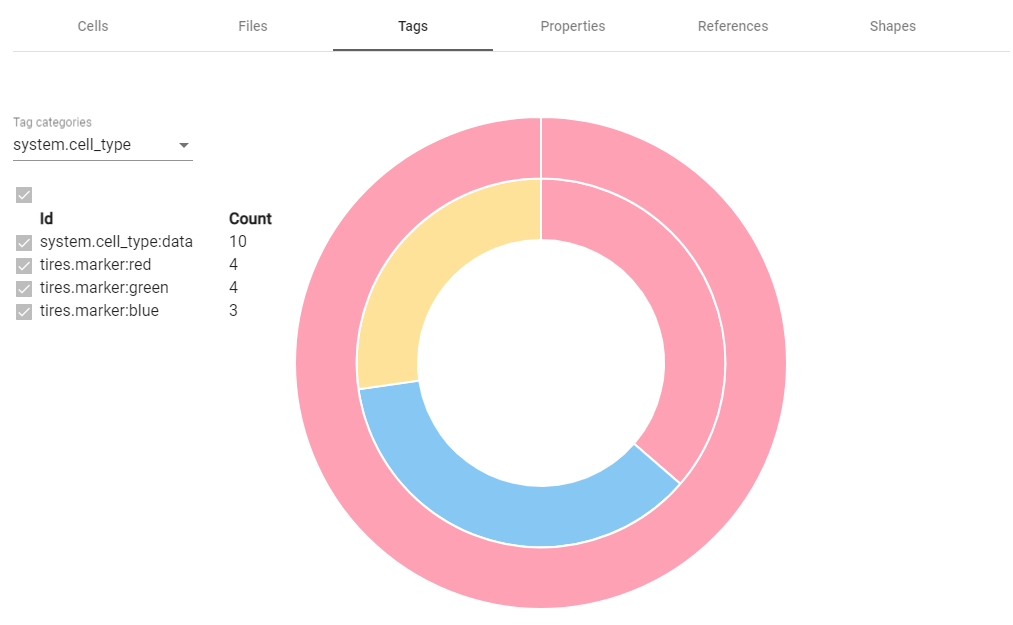
Figure 7. Tags count graph
Properties
The Properties statistics display information about the existing Properties.
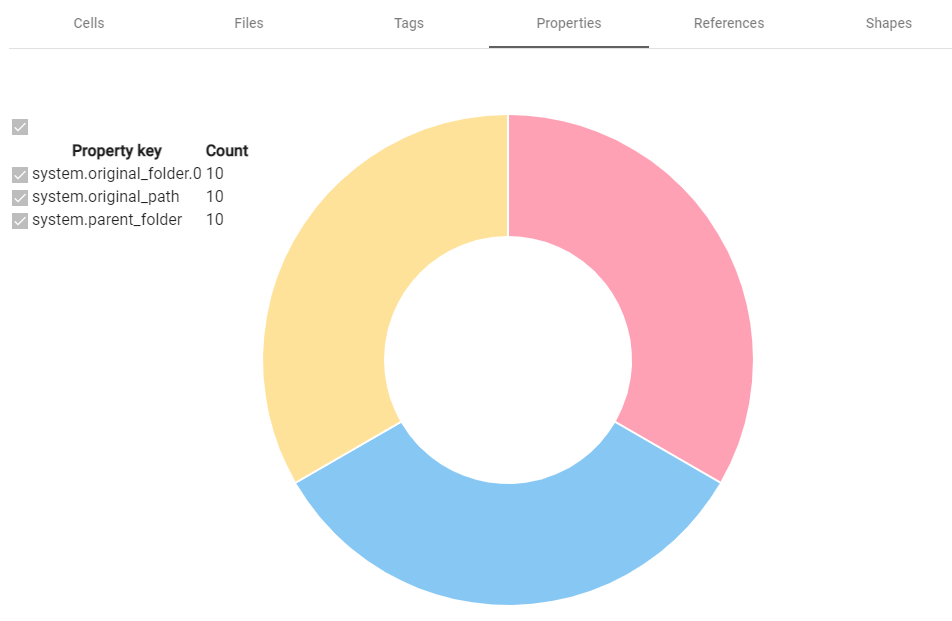
Figure 8. Properties count graph
References
The References statistics showcase the number of References between the Cells, sorted by the Reference’s key.
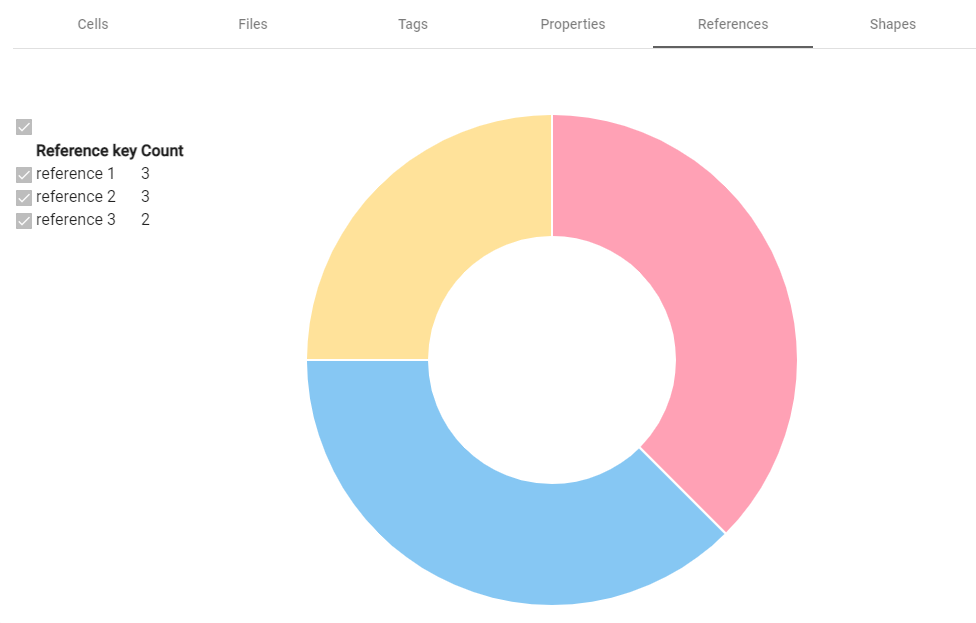
Figure 9. References count graph
Shapes
The Shapes statistics present the number of Shapes. Each ring in the graph represents the shapes within one Overlay. The option to Squash overlays compares the total number of Shapes across all Overlays.
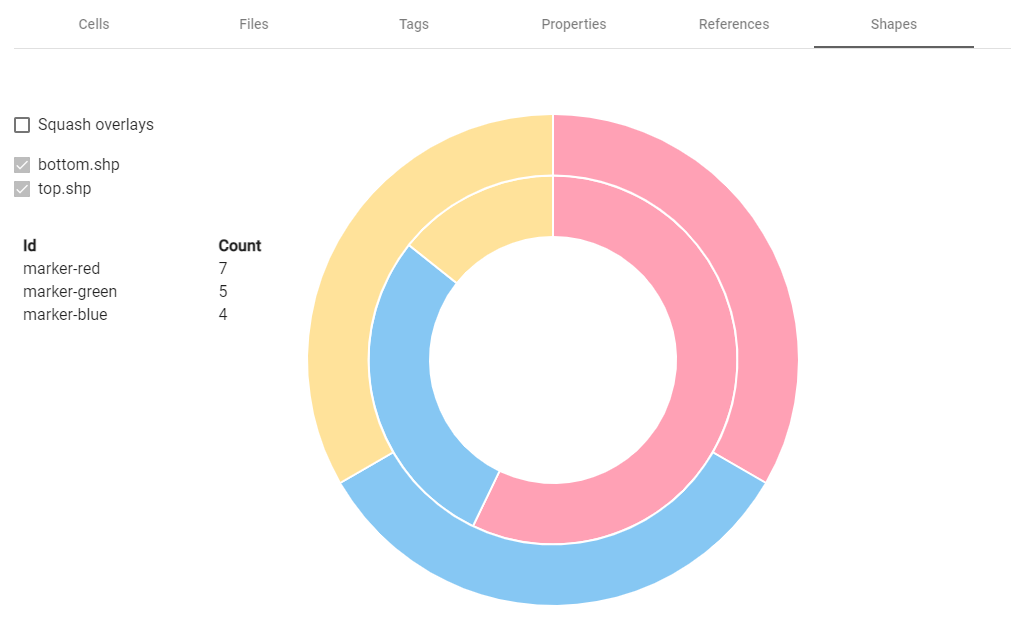
Figure 10. Shapes count graph